
Shock absorber fluid dynamics is generally perceived as complex. Sharp turns, high transients, flow separation, and laminar to turbulent transitions further complicated by non-Newtonian fluid properties are perceived to create unquantifiable fluid dynamic mysteries in the internal flow.
However, dyno testing of shock absorbers show none of those complex effects. Damping force is smooth and continuous with the shape and magnitude of damping force dictated by the basic fluid dynamics of ideal Bernoulli flow.
Fluid dynamics
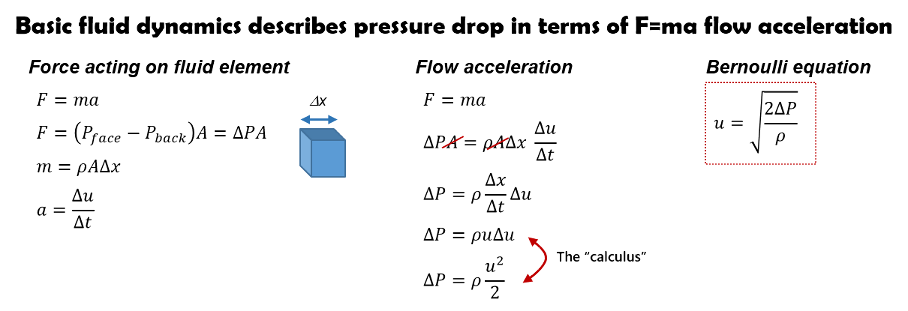
Fluid dynamics defines pressure drops and flow rates in terms of the F=ma force required to push fluids through a flow restriction.
For an arbitrary shaped fluid element, the pressure on the forward face defines the force pushing the fluid downstream. Pressure on the back side, multiplied by area, defines the force pushing upstream. The difference defines the net force acting on the fluid.
Mass, the second component of F=ma, is defined by the fluid element volume multiplied by the fluid density.
With force and mass defined the basic physics of F=ma specifies the fluid acceleration and the ultimate flow velocity.
Fluid dynamics solves the F=ma equation to determine the flow velocity (u) generated a specified pressure drop. That basic fluid dynamic relationship is known as the Bernoulli equation.
Mass flow
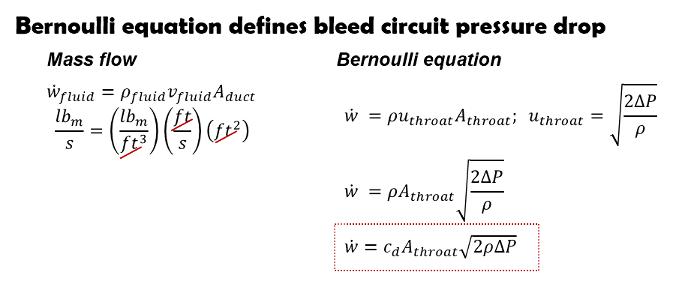
Combining the flow velocity, area and density defines mass flow. Combining the mass flow equation with the Bernoulli equation defines the fluid circuit mass flow at a specified pressure drop.
Clicker bleed circuits control the pressure drop and damping force by adjusting the flow area. The Bernoulli equation defines the mass flow and pressure drop through the clicker flow area.
Shock absorber fluid mass flow
Oil in shock absorbers is virtually incompressible. Incompressible flow significantly simplifies fluid dynamics producing a direct relationship between shaft velocity and flow velocity through the fluid circuits.
Base valve flow
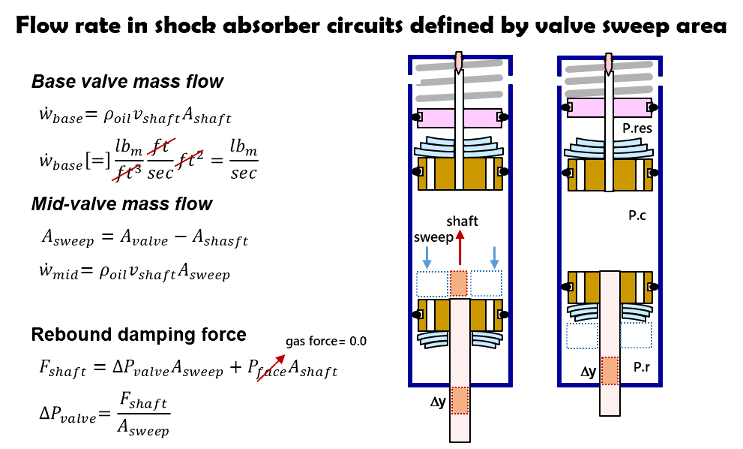
When the shock absorber shaft is driven into the shock and equal volume of fluid is driven out of the shock into the oil reservoir.
Likewise, the valve sweep area (A.valve -A.shaft) defines the volume of fluid flow through the mid-valve with shaft movement.
Force on shock shaft
Damping force from a shock absorber is composed of two parts.
The pressure in the compression chamber (P.c) acting on the damper rod shaft area defines the damping force from the compression adjuster, or fork base valve.
Pressure acting on the valve face defines the second component of damping force. Compression chamber pressure (P.c) acting on the valve face sweep area pushes the piston down. Rebound chamber pressure (P.r) pushes in the opposite direction. The difference between the two forces defines the net force acting on the valve.
On the rebound stroke, the check plate on the compression adjuster (or fork base valve) opens setting the compression chamber pressure (P.c) equal to the gas reservoir pressure (P.res). The gas reservoir pressure acting on the shock shaft is known as the shock “gas force” in dyno testing.
Dyno tests subtract the “gas force” from the measured shaft force. With the gas force subtracted, the damping force measured in rebound is simply the valve pressure drop multiplied by the valve sweep area.
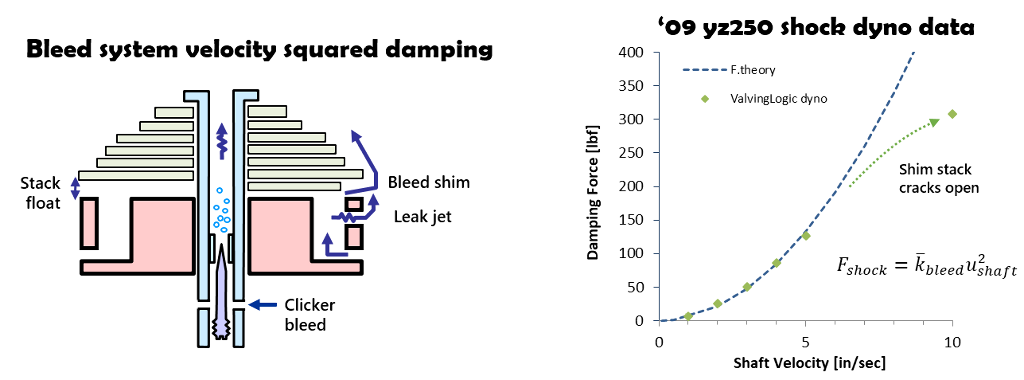
Bleed circuit damping with ideal fluid flow
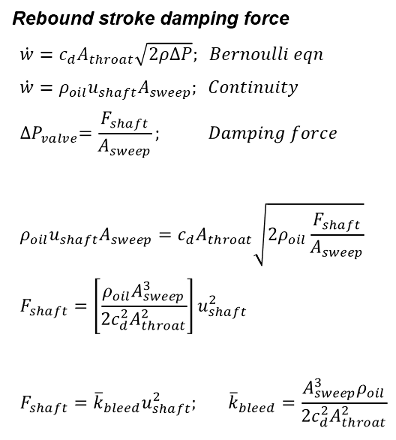
Continuity specifies the relationship between shaft movement and mass flow through the fluid circuits. The Bernoulli equation defines the pressure drop produced by the mass flow and the pressure drop defines the damping force produced on the shock shaft.
Combining those three equations defines the theoretical ideal damping force produced by a shock as a function of shock shaft velocity.
The parameters within the square brackets [clicker throat area, valve sweep area and oil density] are all constants and combined into a single term k.bleed. The result is a simple equation specifying the ideal damping force from the bleed system. Bleed system damping force increases with shock shaft velocity squared.
Dyno verification of ideal fluid dynamics
Damping force measured on the Valving Logic dyno for a ’09 yz250 shock shows the damping force for the bleed system closely follows the ideal fluid dynamic theory of velocity squared damping.
At five in/sec the shim stack cracks open and damping force falls off, as expected.
Dyno tests of the shock absorber include all of the “real-world” effects of complex internal fluid dynamics with highly transient flows, three-dimensional flow fields, flow separations and non-Newtonian fluid properties.
But, those “real-world” effects do not produce any measurable difference in damping force. The data follows basic fluid dynamic theory of velocity squared damping predicted by the ideal Bernoulli flow equation.
The dyno test demonstrates bleed circuit damping is controlled by the ideal fluid dynamic theory of basic Bernoulli flow.
Dyno testing verifies bleed circuit damping controlled by ideal fluid flow velocity squared damping
Shim stack damping with ideal fluid dynamics
Shim ReStackor analysis of a simple tapered shim stack shows the valve flow area increases approximately linearly with force applied to the shim stack face.
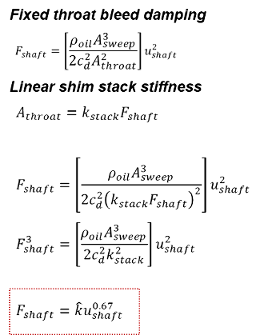
The fixed area throat Bernoulli equation derived above for bleed circuits can be modified to include a variable area throat for the special case of linear shim stack stiffness.
It is important to note, the entire purpose of tuning shim stacks is creating a nonlinear shim stack stiffness to control the shape of the damping force profile. Linear stiffness used in this simple example is generally not the goal.
None the less, the linear stiffness shim stack provides a simple case to evaluate the effectiveness of ideal fluid dynamics to model the complex “real-world” performance of shock absorbers tested on the dyno.
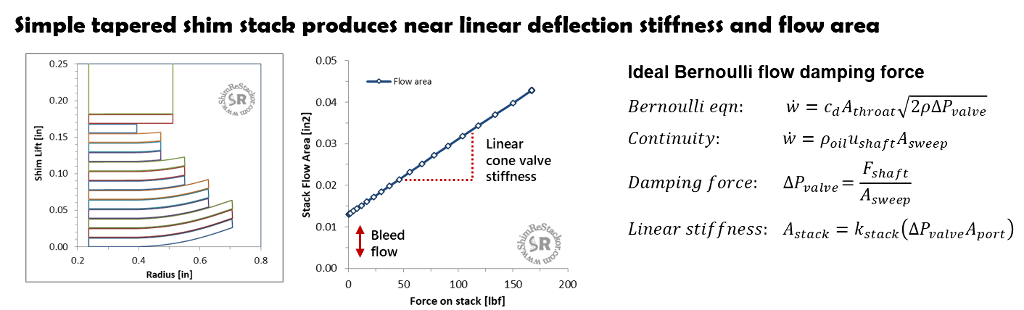
Asserting damping force is proportional to valve pressure drop and applying the assumption valve pressure drop is proportional to the fluid force on the shim stack produces a simple expression for the linear increase in shim stack flow area, A.throat, with damping force on the shock shaft.
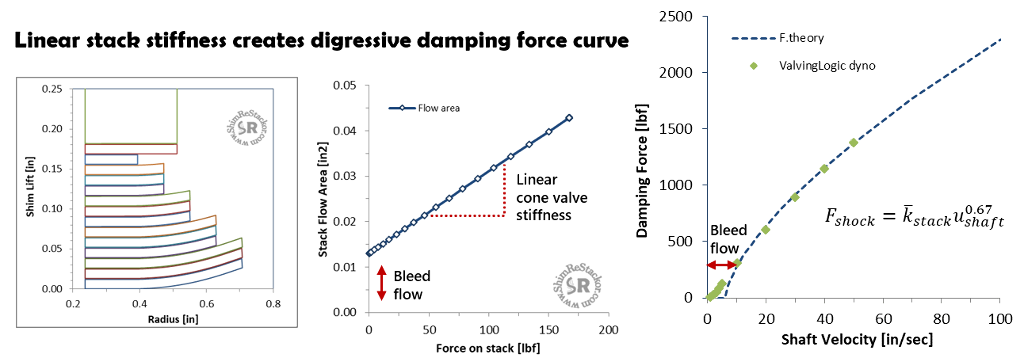
Replacing the fixed throat area of the bleed circuit with the A.throat expression and stepping through the algebra shows the ideal damping force for a linear stiffness shim stack increases with the shock shaft velocity raised to the 0.67 power.
Dyno verification of ideal shim stack damping theory
Dyno tests of the tapered shim stack show damping force falls-off with velocity to the 0.67 power, as expected by ideal fluid dynamic theory.
The damping force measured on the dyno is smooth and continuous with no kinks, bends or discontinuities indicating the presence of flow separations, shifts in 3D flow streamlines or flow transients driving damping force off of the ideal fluid dynamic theory of the 0.67 power law curve.
The theoretical 0.67 power law curve starts at 6 in/sec where the shim stack cracks open. Velocities below 6 in/sec are controlled by the bleed system and produce the expected velocity square damping demonstrated in the previous example.
Dyno testing verifies digressive 0.67 power roll-off predicted by ideal fluid dynamics
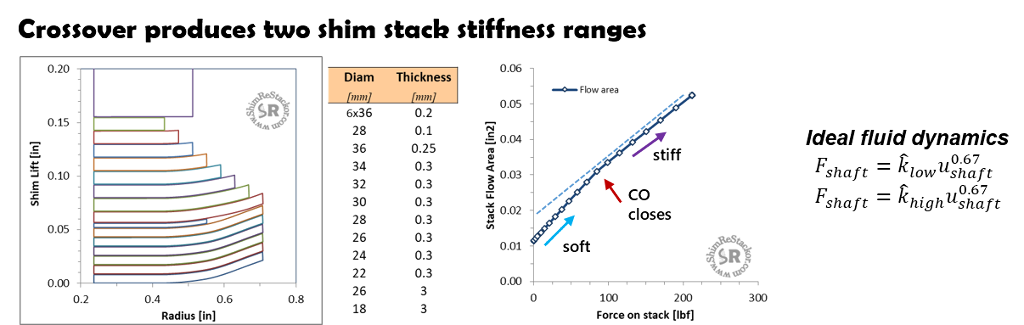
Crossover damping with ideal fluid dynamics
Crossover shim stacks produce soft damping at low speed where the face shims deflect, and stiff damping at high speed after the crossover gap closes. Shim ReStackor analysis of the crossover shim stack shows stiffness is linear in both the low and high speed range.
By theory, damping force through the low speed range should falloff with velocity to the 0.67 power, followed by a second range from the high speed stack also rolling off with velocity to the 0.67 power.
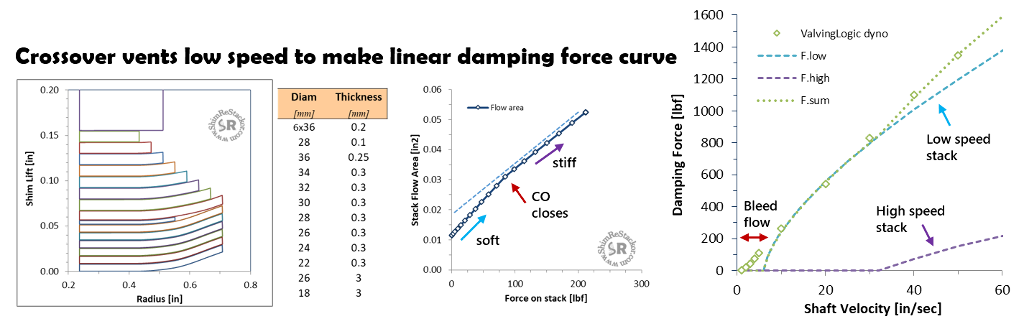
Curve fitting the dyno data with the ideal 0.67 power law theory and adjusting the k.low and k.high constants shows the low speed stack controls damping force from 10 to 30 in/sec (teal curve).
Above 30 in/sec, the high speed stack kicks in (purple curve) augmenting the stiffness of the low speed stack and initiating a second damping force curve that also rolls off with velocity to the 0.67 power.
Adding the two curves together produces a combined damping force that is nearly linear (green line) and matches the dyno test data.
The dyno data shows no evidence of complex non-ideal flow driving the damping force off of the ideal fluid dynamic theory of basic Bernoulli flow.
The dyno data demonstrates adding two nonlinear curves together produces a near linear damping force velocity curve. However, when the shock absorber is pushed to high speed the damping force will roll-off due to the basic fluid dynamics of 0.67 power law damping.
Dyno test verifies combining two digressive curves produces a near linear damping force as predicted by ideal fluid flow theory
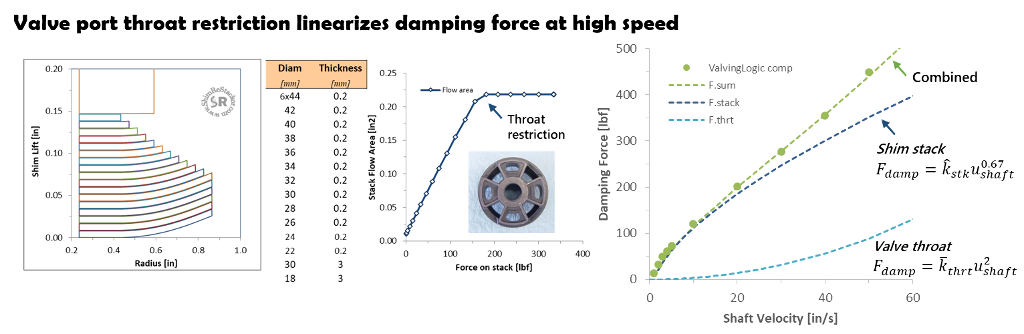
Throat restriction theoretical damping
Dyno testing demonstrates a second way to linearize damping force curves using valve port throat restrictions.
- Fluid dynamics dictates shim stack damping rolls-off with velocity to the 0.67 power
- Fluid dynamics also dictates flow restrictions increase damping force with velocity squared
Combining the shim stack digressive roll-off with the progressive damping of a valve port throat restriction produces a near linear damping force curve. Valving Logic dyno testing demonstrates the effect.
Dyno tests verify ideal fluid dynamic theory of digressive shim stack damping combined with a throat restriction
Dyno tests verify theoretical damping curve
Shim stack damping rolls off with velocity to the 0.67 power. Curve fitting the dyno data by adjusting the k.stk constant shows the shim stack controls damping from 5 to 20 in/sec (blue curve).
Above 20 in/sec shim stack damping rolls off and the valve port throat restriction begins increasing the damping force (teal curve). Summing the valve throat and shim stack damping curves together gives a combined damping force curve that is nearly linear matching the damping force measured in dyno testing.
Both the shim stack and valve throat damping force curves are nonlinear. But, when added together the result is near linear.
However, when pushed to high speed, the velocity squared increase in damping from the valve port throat restriction will force the damping force velocity curve to become progressive.
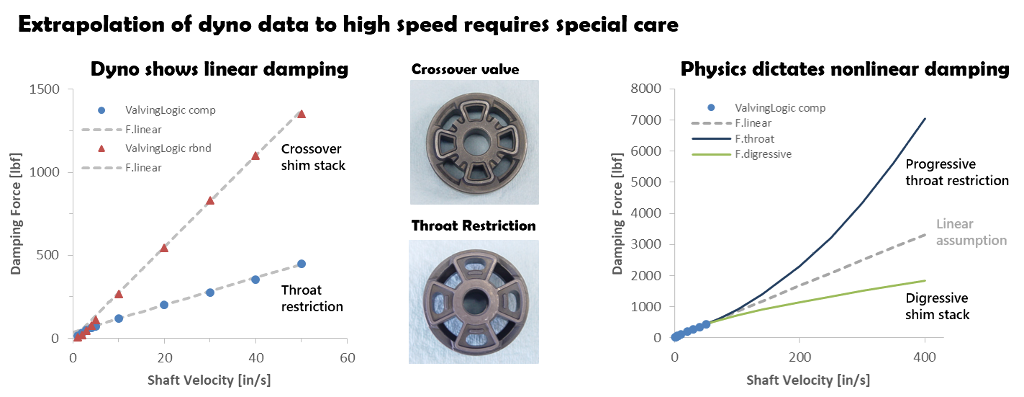
High speed dyno data extrapolation
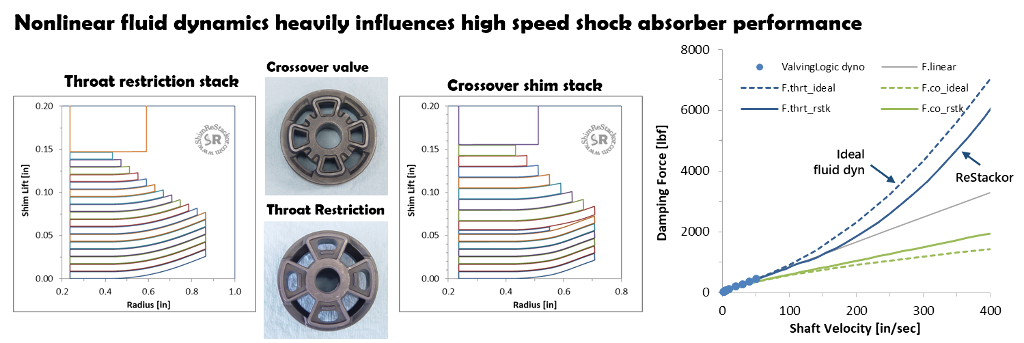
The dyno testing of the crossover shim stack and valve throat restricted case both show near linear damping. Based on close inspection of the dyno test data, linear extrapolation to the 400 in/sec bottoming velocity of a fork appears reasonable.
However, fluid dynamics dictates damping force is nonlinear. Shim stack controlled damping of the crossover case will roll-off with velocity to the 0.67 power at high speed. Damping force from the valve port throat restriction will increase with velocity squared.
Extrapolation of the dyno test data applying the basic physics of fluid dynamics shows the shim stack controlled valve rolls-off at high speed producing approximately half of the damping force expected by linear extrapolation. And, the valve port flow restricted case causes damping force to double.
Those are big differences and emphasize trends observed in low speed dyno testing have little to do with the high speed performance of shock absorbers.
Extrapolation of linear damping force “trends” observed in dyno testing creates large errors at high speed
Shim ReStackor high speed damping
Shim ReStackor calculations for the valve port throat restricted case shows high speed damping is approximately 1,000 lbf below ideal theory.
The cause is fluid jet impingement on the shim stack face. At low speed, the pressurized valve port pocket area controls forces applied to the shim stack face. At high speed, the fluid jet from the valve throat restriction shifts the pressure to the outside edge of the shim stack giving more leverage and increased deflection of the shim stack reducing the flow resistance and damping force at high speed.
The crossover shim stack shows the opposite effect with increased damping force at high speed. Flow restrictions at the valve port entrance cause the increased damping force at high speed in Shim ReStackor calculations.
Shim ReStackor calculations account for entrance flow restrictions, valve port flow restrictions, fluid jet impingement, flow turning losses, viscous losses, boundary layer displacement flow distortions and laminar to turbulent flow transitions.
Those effects make little difference at low speed as demonstrated by the close agreement of ideal fluid dynamic theory with dyno test data.
However, those effects become increasingly important at higher speeds driving damping force away from ideal fluid dynamic theory of Bernoulli flow and the linear damping force trends observed in low speed dyno testing.
Shim ReStackor calculations apply the basic principles of fluid dynamics and use those fundamentals to produce physics based damping force calculations across the entire range of suspension velocities spanning the gap between dyno testing and practical suspension velocities.
Shim stack stiffness, valve port throat restrictions and port inlet restrictions dictate nonlinear damping force values at high speed